Followers went up this month. Did sales? A marketing report can look healthy while the till stays quiet. Digital marketing KPIs are the short list of numbers that settle the question, because each one is tied to a result you can bank. This guide is for small-business owners and marketers in India who want fewer numbers and clearer calls on budget. You'll get a KPI shortlist for each channel, a way to set targets in rupees, and a few places where Google's own reports can mislead you.
What are digital marketing KPIs?
Digital marketing KPIs are the measurable numbers that show whether your online marketing is moving a business goal such as leads, sales or revenue, for example a booked appointment or a paid order. Each one carries a target and a deadline, say, qualified leads from Google Ads by March. A metric only records what happened: clicks, impressions, followers. It becomes a KPI when you tie it to a goal. Pick three to five KPIs per goal and review them on a fixed day each week.
Put the KPIs at the top of your dashboard and the supporting metrics below them. For a clinic, booked appointments is the KPI. Calls, clicks and page views explain it.
Why do KPIs matter for Indian businesses?
Digital media took nearly 46% of India's total ad spend in FY25, according to Crisil Intelligence figures reported by IBEF, so online budgets now need targets like any other cost.
IBEF adds that digital's share was 24% in FY20, so it has nearly doubled in five years. Traditional media held around 65% of spend then and has fallen to 46 to 47%.
Example (assumed figures, not a benchmark): a Pune dental clinic spends ₹30,000 a month on Google Ads and ₹30,000 on Instagram ads. Google Ads books 15 appointments at ₹2,000 each. Instagram books 6 at ₹5,000 each. Both bring similar clicks, so only cost per booked appointment shows where the next rupee should go.
How does KPI tracking work?
KPI tracking follows the buyer's path from impression to revenue, and each stage gets one number that feeds the next.
Click-through rate (CTR) is clicks divided by impressions. Google's example is 5 clicks on 100 impressions, a 5% CTR. Google Ads divides conversions by ad clicks for conversion rate, and total cost by conversions for cost per conversion. Google Analytics 4 then records the actions you mark as key events, such as a form submission.
Google Ads reports a conversion on the date of the click, so last week's lead count can still rise this week. Judge a campaign after its sales cycle ends. Our conversion funnel guide maps each stage.
Which KPIs should you track for each channel?
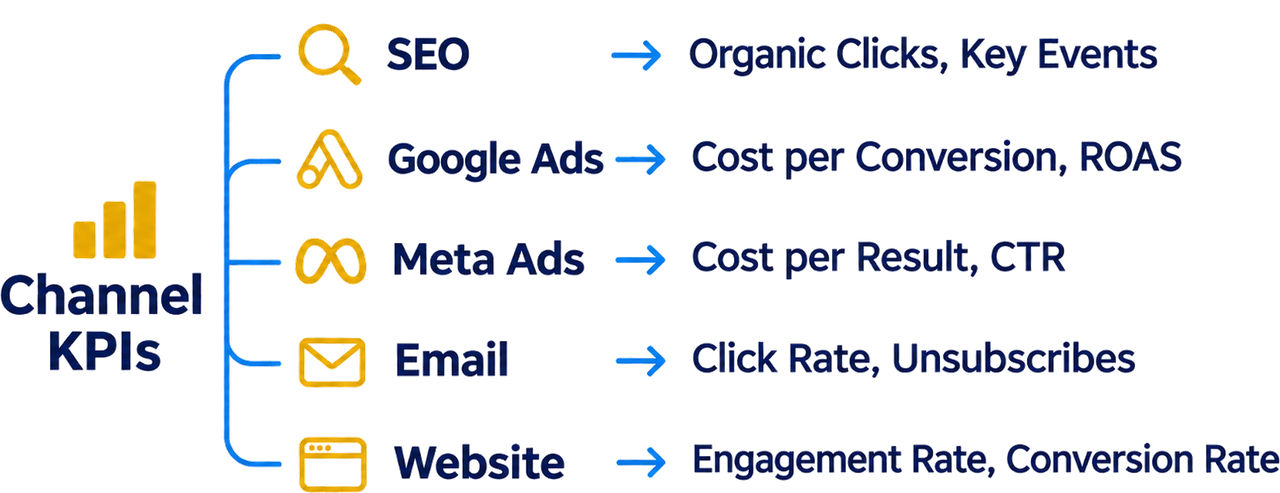
Each channel needs two KPIs matched to its job, and the table covers five a small business might fund.
| Channel | KPIs to track | Question it answers |
|---|---|---|
| SEO | Organic clicks, key events | Is search sending buyers? |
| Google Ads | Cost per conversion, ROAS | Do paid clicks pay back? |
| Meta Ads | Cost per result, CTR | Is the creative earning clicks? |
| Click rate, unsubscribes | Is the list healthy? | |
| Website | Engagement rate, conversion rate | Do visits become action? |
Fill only the rows for channels you pay for today. A B2B firm should add cost per sales-qualified lead, since cheap leads that never buy still cost the sales team time.
How do you set up KPIs step by step?
Setting up KPIs takes seven steps, from one business goal to a fixed review day.
- 1.Write one business goal, such as more dealer enquiries.
- 2.Choose the KPI that proves it, such as qualified enquiries a month.
- 3.Pull last quarter's numbers as your baseline.
- 4.Set a target and a deadline.
- 5.In Google Analytics 4, mark key events: form submissions, WhatsApp clicks, call taps.
- 6.Build one dashboard page that shows only these KPIs.
- 7.Review ad KPIs weekly and SEO KPIs monthly. Move budget toward what pays back.
Example: a Ludhiana auto-parts dealer can finish steps 1 to 6 in a day. The first real read comes a month later.
How do you measure website KPIs in Google Analytics 4?
Google Analytics 4 measures website quality through engagement rate, key events and attribution, and each one needs a setting checked on day one.
Google's Analytics Help calls a session engaged if it lasts longer than 10 seconds, has a key event, or has 2 or more page views. Engagement rate is the share of sessions that pass. Bounce rate is its opposite.
Retention is next. Google lets you keep user-level and key event data for 2 months or 14 months, so choose 14 for a longer history.
Attribution reports leave direct visits out of the credit unless the whole path is direct. Read direct traffic on its own.
How do you measure ROAS and cost KPIs in rupees?
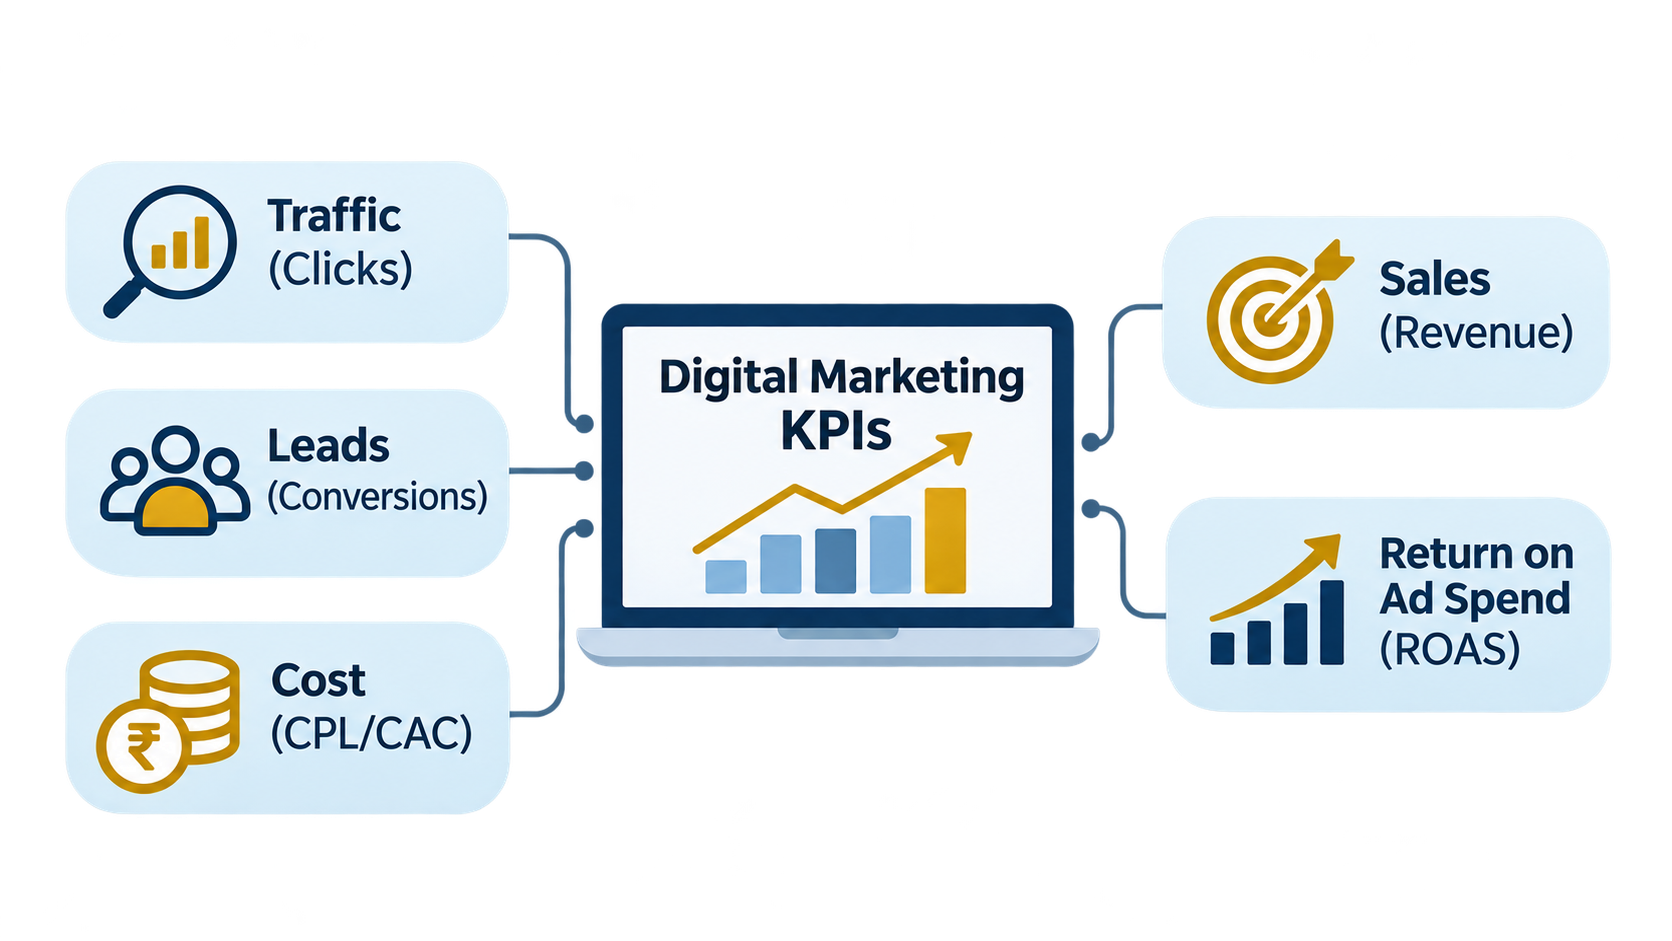
The first money KPIs to watch are ROAS, cost per lead and customer acquisition cost, because each one sets what you spend against what comes back.
Return on ad spend (ROAS) is sales divided by ad spend, times 100%. In Google's example, a 500% target means revenue five times the spend. Cost per lead is ad spend divided by leads. Customer acquisition cost (CAC) is total marketing spend divided by new customers.
Example (assumed figures, not a benchmark): a Surat saree seller spends ₹50,000 on Meta Ads and books ₹2,25,000 in sales. ROAS is 450%. At a 25% margin, break-even ROAS is 400%, so profit is ₹6,250.
Meta may spend up to 75% over your daily budget on better days, so read cost KPIs weekly. Our ROI in digital marketing guide covers the full sum.
What mistakes and challenges should you expect?
These mistakes push small businesses to move budget the wrong way, and each is easy to avoid once you can spot it.
- Treating likes and reach as sales.
- Tracking twenty KPIs, so nobody reads the report.
- Reading Search Console's average position as your rank. Google counts the topmost position for each query, so positions 2 and 3 average 2.5.
- Skipping key events, which leaves Google Analytics 4 showing traffic with no outcomes.
- Counting every WhatsApp chat as a lead.
- Moving the target after a bad month.
Pro Tip: give every KPI one owner and one review date, and write the owner's name beside it on the dashboard.
What KPI trends matter in 2026?
Measurement in 2026 leans on modelled data and AI search visibility, so your KPIs have to work with less user-level tracking.
Google made Meridian, its open-source marketing mix model, available to everyone on 29 January 2025. A marketing mix model estimates each channel's contribution from total spend and sales, without following individuals.
Google's documentation says visits from AI Overviews and AI Mode are counted in the Search Console Performance report under the Web search type. Read them with your organic clicks.
IBEF reports that social media holds 40 to 45% of digital ad spend and has overtaken search. If you advertise there, give social its own KPI.
What Should You Do Next?
Digital marketing KPIs turn scattered reports into a short list of numbers that show whether your marketing pays for itself. This week, write one business goal, pick three KPIs that prove it, and mark the matching key events in Google Analytics 4. Then fix a review day, the same weekday each week, and keep it. If leads vanish between the click and the enquiry, our conversion rate optimization team can audit the funnel and set targets you can track.
Frequently Asked Questions
Common digital marketing KPIs are click-through rate, conversion rate, cost per conversion, return on ad spend and customer acquisition cost. Add organic clicks from Search Console if SEO matters to you, and engagement rate from Google Analytics 4 for your website. Drop any KPI that no decision depends on.
Google and Meta don't document a 3-3-3 rule, so treat any version you read as one person's checklist. If you want a version to test, track three KPIs, across three channels, for three months before you judge results. That's a rule of thumb, not a standard.
No official list of seven pillars exists. A practical set for a small business is search, paid ads, social media, content, email, your website and analytics. Give each pillar one KPI and you have a seven-line scorecard you can read in five minutes. Seven is a convenient count, not a Google or Meta standard.
A practical five are click-through rate, conversion rate, cost per conversion, return on ad spend and customer acquisition cost. Together they follow a buyer from ad to sale. Swap in cost per lead if you sell services, and keep the list at five so the report stays readable.
A KPI is a metric tied to a business goal, with a target and a deadline. A metric is any number your tools record. Impressions, clicks and followers are metrics. Cost per lead becomes a KPI once you set a target for it, such as a lower cost per qualified lead by quarter end.
Three to five per goal is a workable limit. More than that and the report stops getting read. Pick the ones a decision depends on, review ad KPIs weekly and SEO KPIs monthly, and cut any KPI that nobody acted on in a full quarter.